![]() ISSN: 1885-8031
ISSN: 1885-8031
https://dx.doi.org/10.5209/REVE.84396
Riesgo crediticio y rentabilidad de depósitos a corto plazo en las cooperativas de ahorro y crédito. El caso de Perú
Gianluca P. M. Virgilio[1]![]() ,
Nixon Luis Más Caro[2]
,
Nixon Luis Más Caro[2]![]() ,
Rolando Nolverthy Minga Sarmiento[3]
,
Rolando Nolverthy Minga Sarmiento[3]![]() ,
Jhanely Dávila Rivera[4]
,
Jhanely Dávila Rivera[4]![]() e Ítalo Reátegui Díaz[5]
e Ítalo Reátegui Díaz[5]![]()
Recibido: 2 de julio de 2021 / Aceptado: 28 de junio de 2022 / Publicado: 16 de diciembre de 2022
Resumen. En tiempos de tasas de interés históricamente bajas, las cooperativas de ahorro y crédito parecen prometer tasas altas con un riesgo crediticio comparativamente bajo. Perú es uno de los países más desarrollados de América Latina en lo que respecta al sector cooperativo y uno atractivo, ya que se espera que esas instituciones paguen tarifas muy superiores a las del mercado. El valor de este documento es evaluar si las tasas de retorno están justificadas por un riesgo crediticio proporcionalmente alto, o de otra manera. Esta investigación describe las características del mercado de Cooperativas de Ahorro y Crédito peruano y destaca las herramientas de salvaguarda utilizadas para garantizar a sus asociados del riesgo crediticio. El documento utiliza datos oficiales 2007-2018 para las 143 cooperativas peruanas por la autoridad financiera y aplica varias metodologías ampliamente aceptadas por académicos y profesionales para evaluar el riesgo crediticio de todo el sector, a saber, una producción de razones financieras, análisis de los estados financieros, Beaver’s modelo, modelo Bathory, Z-Score, análisis Springate, análisis Logit y modelo H-Factor. Encuentra que el riesgo en la industria se compara favorablemente con los retornos, lo que resalta la existencia de una anomalía en el mercado. De hecho, las cooperativas de ahorro y crédito peruanas ofrecen tasas de interés pasivas de hasta dos dígitos a los depositantes, mientras que el riesgo correspondiente se ha calculado en este documento como comparablemente bajo. Las cooperativas no presentan riesgo de quiebra bajo ninguna de las herramientas utilizadas para la realización del análisis.
Palabras clave: Quiebra; Riesgo crediticio; Países en desarrollo; Riesgo financiero; Microfinanzas; Cooperativas de ahorro y crédito.
Claves Econlit: G11; G21.
[en] Credit risk and profitability of short-term deposit at Savings and Credit Cooperatives. The case of Peru
Abstract. In times of record-low interest rates, Peruvian Saving and Credit Cooperatives seem to promise investors high rates with comparably low credit risk. Peru is one of the most developed countries in Latin America as far as the cooperative sector is concerned and an attractive one as those institutions are expected to repay very much above market rates. The value of this paper lies in evaluating whether high return rates are justified by a proportionally high credit risk, or otherwise. This research describes the characteristics of the Peruvian Saving and Credit Cooperative market and highlights the safeguarding tools used to protect their associates from credit risk. The paper uses official 2007-2018 data for all 143 Peruvian cooperatives supervised by the financial authority and applies several methodologies widely accepted by academics and practitioners to assess credit risk of the whole sector, namely a production of financial ratios, analysis of the financial statements, Beaver's model, Bathory model, Z-Score, Springate analysis, Logit analysis and H-Factor model. It finds that risk in the industry compares favourably to returns, so highlighting the existence of a market anomaly. Indeed, Peruvian Saving and Credit Cooperatives offer up to two-digit passive interest rates to depositors while the corresponding risk has been computed in this paper as being comparably low. The cooperatives do not display risk of bankrupt under any of the tools used for carrying out the analysis.
Keywords: Bankrupt; Credit risk; Developing countries; Financial risk; Microfinance; Saving and credit cooperatives.
Summary. 1. Introduction. 2. Literature review. 3. Saving and credit cooperative organizations. 4. Saving and credit cooperatives in Peru. 5. Methodology. 6. COOPAC Accounting evaluation. 7. Discussion. 8. Conclusion. 9. References.
How to cite. Virgilio, G.P.M.; Más Caro, N.L.; Minga Sarmiento, R.N.; Dávila Rivera, J.; Reátegui Díaz, I. (2022) Credit risk and profitability of short-term deposit at Savings and Credit Cooperatives. The case of Peru. REVESCO. Revista de Estudios Cooperativos, vol. 142, e84396. https://dx.doi.org/10.5209/reve.84396.
1.1. The Peruvian Credit and Saving Cooperative
Peru
is one of the countries where Saving and Credit Cooperatives (Cooperativas
de Ahorro y Crédito or CoopACs) are most developed in Latin America: “Las
cooperativas de ahorro y crédito no autorizadas a captar recursos del público
(Coopac) constituyen uno de los vehículos de cooperación social más antiguos
del Perú, y su importancia para el desarrollo económico y la inclusión financiera
del país es innegable, especialmente en aquellos sectores más lejanos y
vulnerables del Perú” (The savings and credit cooperatives not authorized
to attract resources from the public (Coopac) constitute one of the oldest
vehicles of social cooperation in Peru, and their importance for the economic
development and financial inclusion of the country is undeniable, especially in
those sectors that are more remote and vulnerable in Peru. Source: www.sbs.gob.pe/coopac). They are the
institutions located at the most flexible end of the credit supply chain in as
much as CoopACs lend money to people and enterprises that could not get any
credit from the traditional finance sector, levying high interest rates to
cover the high risk they incur in, and at the same time paying high interest
rates to the associates depositing their money in the cooperative’s account.
Face to all-time-low interest rates, some cooperatives in Peru proudly offer
high single-digit and even double-digit interest rates for short-term deposits.
All this may sound suspicious and thus attracted the attention of investors and
academics alike, for opposite reasons. If in times of record-low interest rates
investors look for higher returns, scientific research is justly suspicious
about such an apparent anomaly in the financial system. It therefore seems
worth investigating whether a market anomaly has
been found or this is yet another example of the well-known
high-return/high-risk dilemma, where historical precedents tell us the
inevitable outcome of excessively rosy expectations.
The main goal of this paper is to investigate whether there exists a financial anomaly in the Peruvian debt market (low risk compared to high profitability) or profitability-risk ratio is adequate since Peruvian Saving and Credit Cooperatives are highly risky institutions, and therefore the high repayments they promise just balance out their default risk.
1.2. Justification of this study
In this sense, this research seeks to work out a financial diagnostic based on several statistical bankruptcy evaluation criteria: Beaver’s Model, Bathory Model, Z Scores, Springate Analysis, Logit and H-Factor to evaluate the financial performance of savings and credit cooperatives in Peru. On the other hand, it is considered that the financial performance of companies is measured by profitability, solvency, and the ability to meet its obligations, among other analysis factors. These can be obtained through indices that are calculated from the values in the accounting accounts of the financial statements. Financial analysis through ratios is a useful tool to improve the performance of organizations (Bernal Domínguez & Amat Salas, 2012, p. 271). The CoopAC system will then be evaluated against its performance on all the criteria mentioned above. It is important to understand whether Saving and Credit Cooperatives are solid as they are one of the fundamental pillars of the Peruvian micro and small enterprise sector.
Section 1 introduced the topic, section 2 reviews the literature, section 3 explores functions and practices of the CoopACs, section 4 describes the legal framework and main practices adopted by the cooperatives in Peru. Then, section 5 presents the methodology to assess the riskiness of the cooperatives and section 6 critically evaluates the ratios and other risk indicators derived from the financial accounts of Peruvian CoopACs. Section 7 discusses the findings and section 8 concludes.
2. Literature review
“Credit is much older than writing”
A. Brown (2004) ‘The Origins and Evolution of Credit Risk Management’
2.1. Credit risk
A good definition of credit risk is supplied by Bandyopadhyay (2016, p.1): “Credit risk is the potential that a bank borrower or a group of borrowers will fail to meet its contractual obligations and the future loss associated with that”. Actually, if a borrower defaults on its debt, the losses for the lender usually outweigh the expected gains many times. In recent years several tools have been implemented to ensure a smooth operation of credit activities, from Basel accords to stress tests, establishment of financial and banking authorities, information and transparency requirements, and many more (Baesens et al., 2016). Yet, banks and other financial institutions do occasionally fail and ruin ordinary people who trusted them in good faith and bad ignorance of even basic risk management techniques. After a few millennia of borrowing and lending money the problem still seems unsolved.
2.2. Microfinance
The modern concept of microfinance took its origin from the work of 2006 winner of Nobel Prize for Peace, Muhammad Yunus (Bornstein, 1997; Yunus, 2007), who started operations with a mere 25 US dollar loan to a group of villagers in Bangladesh in 1974 (Chen, 2017). The initiative developed further and in 1983 brought him to founding Grameen Bank, with the purpose “to help poor people to get out of poverty” [author’s translation] (Conger, Inga and Webb; 2009, p.112). The financially brave intuition was that poverty is not a consequence of culture, geography, history or DNA; it is merely caused by lack of opportunities. Providing funds was the first necessary step to defeating poverty and leading to economic development, a win-win scenario for both investors and debtors. Microfinance was then created with the aim of targeting those entrepreneurs who are at the base of the economic pyramid and cannot access loans from regular banks, granting them capital to enter business, and therefore contributing to regional economic development and alleviating world poverty (Newman, Schwarz and Ahlstrom., 2017; Shahriar and Garg, 2017). The first institutionalized microfinance entity, Acción, had a 99.5% repayment rate in its first year of operations. Yet, not all of Micro Finance Institutions (MFIs) were moved by the same spirit that inflamed Yunus and other bona fide organizations: one Nigeria-based MFI used to charge its debtors interest rate up to 100%, something that spread doubts about the viability of the whole initiative and the MFI idea itself (Davidson, 2013). In Peru debtor interest rates were above 80% in 1995 and only in the last decade they fell around the 30% to 50% range. Not surprisingly, the dollar amount of credit rose more than 20 times in the same period, from $162 million to $3,841 (Conger, Inga and Webb; 2009). In a difficult-to-gauge cause-effect relationship, Peruvian GDP also rose consistently over the last twenty-five years. Yet, recent estimation gauges Peruvians living in poverty to be over 36% and nearly 13% in extreme poverty (Davidson, 2013). Microfinance has quickly been understood by micro-entities as small-scale financial services aimed at people or businesses located at the base of the income pyramid. Therefore, the Peruvian microfinance sector has developed rapidly: the number of jobs in MFIs grew from nearly 8,500 in 2005 to over 27,000 in 2010 (APEC, 2011). High level of poverty and widespread micro entrepreneurial activity make a perfect mix for a flourishing microcredit industry (Pait, 2009). In a period of record-low interest rates, international investors have been attracted by microfinance because of its high interest rates and reasonably safe returns: they have significantly increased investment in MFIs, especially on large ones (Intrisano and Micheli, 2015).
2.3. Saving and Credit Cooperatives
The first Savings and Credit Cooperatives were established in Germany around the mid of the XIX century. The cooperatives ensured several advantages to their members – and most of them are still in force today. Cooperatives are institutions specifically created to provide credit to economic entities widely sparse in the territory, which traditional banks have practical difficulties to take care of. They are ready to provide small loans that other institutions might find unprofitable to manage; cooperatives require little bureaucracy to ensure funding, something large banks cannot afford. Moreover, CoopACs require little or no collaterals for the money they loan, except in the case of considerable amounts, for which collateral is required. On the other side, the risks cooperatives accept are somehow balanced by the fact that all investors providing money to the cooperative (and through it, to the microenterprises) are members of the cooperative itself, so they provide money on shareholding capacity rather than as lenders. This, according to Angulo Villarreal (2019), greatly reduces the risk of the organization, passing it over to investors. Moreover, no matter the amount of money provided, the member only possesses one vote in the general assembly, not a number proportional to the money invested. Risk and profitability are mixed to suit investor’s needs and likes. Peruvian cooperatives own their existence to the struggles carried out by the peasants during the two decades around the mid of the XX century (Borda Mamani and Basso, 2020). According to AsoMiFPeru (Asociación de Instituciones de Microfinanzas del Perú), out of seven million borrowers in the Peruvian financial system, more than 40% are clients of cooperative institutions with a rate of women entrepreneurs more than twice those served by the traditional banking system (58% versus 26%). Three micro entrepreneurs out of four are customers of the microfinance system (APEC, 2011). The main peculiarities of the Peruvian microcredit model are direct consequences of the environment they operate in and the Savings and Credit Cooperative principles that will be discussed in the next section.
2.4. Profitability vs. Risk
This study builds on previous research on the relationship between profitability and risk and it evaluates such a relationship with respect to Peruvian CoopACs, contributing to the knowledge of the saving and credit cooperatives as well as the situation of microfinance in Latin America.
Finance academics, as well as practitioners, know very well that there exists a trade-off between profitability and risk. One of the pillars in finance is that high profitability comes together with high risk and if an investor wishes to reduce her risk, will have to content herself with lower profitability (García-Gutiérrez Fernández, 2000; Brealey et al., 2019; Brealey et al., 2020; Ross et al., 2022). This is a basic principle originated from microeconomics (Goolsbee:et al., 2020; Krugman and Wells, 2020, among others) if, ceteris paribus, the risk of an asset increases (decreases), the demand for that asset will diminish (augment) with respect to other similar assets (similar as far as price, duration, marketability, etc.). Following the demand-offer law, the only way to keep equilibrium will be a downward (upward) price change, improving (reducing) profitability/risk ratio. Occasionally, price misalignments occur and it is possible that the market does not realize at once that risk and price are not in sync. This must be regarded as a market anomaly as it allows arbitraging (Banner and Ferholz, 2008; Marshall et al., 2013), that is, selling the overpriced security and buying the underpriced one, achieving a low-risk or even risk-free return. Such anomalies may indeed continue for quite a long time and the history of finance is plenty of such examples, starting from the Tulipomania in the XVII century (Kindleberger and Aliber, 2005), through the 1929 Great Crash (Galbraith, 2009), to the 2008 subprime crisis (Sherman and Tana, 2008), just to mentions a few. Nevertheless, bubbles have always been exposed and the consequences have always been painful. For this reason, it is important to highlight the potential anomaly in the Peruvian debt market, studying the characteristics of high profitability compared to corresponding low risk, and warning investors of a possible bubble, inexorably destined to go off, sooner or later.
3. Saving and credit cooperative organizations
For Rayo Canton et al. (2010), the construction of a credit evaluation model for cooperativs in Peru implies a series of limitations and disadvantages that increase the difficulty in reaching reasonable results in debtor evaluation. These limitations are listed below.
a) Credit history. CoopAC’s client is usually characterized by having irregular and/or incomplete records. In order to analyse the payment behaviour of a microcredit client, a comprehensive database is required that collects the history of the loans that have been unpaid in some of their instalments since their grant until the expiration date. Yet, the Risk Centre (Central de Riesgos), managed by the Peruvian financial authority, keeps track of all loans conceded in the country, together with payment record. Being in the black list of bad payers prevents the concession of further loans; this is a rather strong incentive to honour financial obligations.
b) Role of the credit analyst. The analyst collects personal and qualitative information about the client, information that could indicate risk factors for the return of the credit granted. However, this process could be highly influenced by the subjective opinion of the analyst.
c) Information system. According to Hayes (1992), there are two ways to evaluate an account: on the basis of financial and non-financial analysis. A non-financial analysis is less expensive in terms of time and money, but it is not as accurate as financial analysis in order to successfully assess credit risk. In most cases, non-financial analysis is the only thing available to help making a good decision. A debtor's assessment evaluates credit risk based on a number of factors, including the client’s credit and payment history, income, and overall financial situation. In the case of cooperatives, the credit evaluation methodology they use differs from traditional banking’s since the former focuses on personal characteristics, faces poor or no documentation, uses many person-hours for each loan granted compared to the loan amounts. In general amounts are small and the credit counsellors must manage many clients to have an acceptable amount in their loan portfolio; repayment of the loans is made, in some cases, in weekly or bi-weekly instalments.
3.1. Credit methodology
The credit methodology is based on several parameters (Asencios Trinidad et al., 2018; Meza Vásquez, 2002).
3.1.1. Analyst omnipresent
Presence of a financial analyst is the most noticeable feature of the model. On the one side, it allows the cooperative to constantly collect information on, and keep control over, the development of the customer’s business and on the other side to show support to the borrower. The analyst shall also gather information about the business through its neighbours, acquaintances and clients, on the basis that in a small community everybody knows everything about anybody. There is thus a strong moral suasion to honour one’s obligations, as bad reputation might hurt more than meagre earnings.
3.1.2. Analysis in situ
Frequent visits of the business are paramount to collect first-hand information. A surprise visit would allow to verify the client traffic, the attractiveness of the business place, the owner's approach to clients, her kindness, and her direct marketing skills. A rather unusual but useful control is cash at the end of the business day. Although this practice might sound odd at the ears of a well-established businessperson, it is an acceptable one in a micro-entrepreneurial environment, where the business owners may show with pride their daily achievements.
3.1.3. Client’s character evaluation
Character is one of the general factors that credit analysts take into account when making a credit granting decision; they are the qualities of honourability, moral solvency and commitment that the client has with the fulfilment of credit obligations. For this, credit institutions are consulted, verifying the payment history of the applicant, whose information will have to refer to the past (how she behaved in past credit operations) and the present (how she is currently behaving with respect to due payments). References are also requested from family members, suppliers and neighbours who have ties with the client, studying their stability with the decisions they make, and which affect their business.
3.1.4. Business management analysis
The experience that the client has in conducting the business is evaluated, whether she coordinates the internal resources properly, complies with the provisions of the municipality, and makes reasonable decisions that allow her to achieve her goals and objectives. Since the management is responsible for the success or failure of the business, it constitutes a fundamental aspect, to be evaluated, for granting of credit. Therefore, the credit analyst also evaluates the entrepreneur skills on leadership, driving and coordination capacity.
3.1.5. Analysis of the family situation
The aim is to know the number of people who depend on the client, if the family is stable or whether marital problems may jeopardise the business; the state of health of each member and how it may affect the expenses of the family unit; verify if the property where they reside is owned or rented; evidence of decision-making regarding the surpluses of the family unit and consequently determine the lifestyle they lead, whether they are saving or wasting the accumulated surplus. All this analysis is aimed at evaluating the client's willingness to pay.
3.1.6. No collaterals
This is definitely the most controversial feature of all. Hardly a traditional bank could loan money, even a small amount, with no collaterals at all - but that is the main characteristic of cooperative business. The no collateral requirement stays there simply because there may exist no collaterals at all to back up the loan. This means going back to a world where ‘my word is my bound’, something forgotten by the industrialized world since two hundred years. Yet, this approach worked well for many centuries before, when the general economic environment was more akin to the one met today by cooperatives and their partners. In relatively small communities, where everyone knows each other, this may still be the case. We are here talking about a world in which Word and Trust had a value in themselves; not a bad thing in general terms!
3.1.7. Business profitability
Knowing the profitability of the business will ensure the efficiency with which the debtor will pay off the credit that has been granted, since it will reveal the company's ability to generate profits with the use of the capital invested in it and the money it has generated. A business is said to be profitable when it generates enough profit or benefit, that is, when its income is greater than its expenses, and the difference between them is considered acceptable. There are many ways to measure the effectiveness and, therefore, the profitability of the business, from a quick analysis of the sales margin, the evaluation of the available profit and the net income of the family, up to the elaboration of indicators or ratios such as, among others, Return on Equity (ROE), Return on Assets (ROA), Gross Margin, Operational Margin and Net Margin. The visit of an analyst to the business premises not only involves evaluating profitability to determine whether or not she is worth conceding credit, but also contributes to the entrepreneur being aware of how to improve her business and subsequently fulfilling the observations that have been made during the evaluation process and that represent sub-optimal values.
3.1.8. Indebtedness through the level of debt and equity
Leverage uses financial mechanisms as a lever to increase investment possibilities. The main mechanism is debt and for this reason it is very important that cooperatives take it into account in the client analysis. A high degree of financial leverage leads to high interest payments on debt, which negatively affects earnings. Knowing all these details of the client will help to estimate her willingness and ability to pay against the financial obligations that she takes, and thus ensure the fulfilment of the credit granted.
3.1.9. Cash Flow
‘Cash is King’ is an old business motto that does not suffer the injuries of time. Checking the cash in- and out-flows is a safe way to ensure end-of-period repayment of debts. Complex calculations for informal businesses (that by definition do not, or seldom, produce financial statements) seems shooting the wrong target, whereas a quick look at the till content just after closing hour promises to yield the most critical information about the business.
3.1.10. Speed and customer proximity
Contrary to traditional banks, cooperatives have a quick response (and lending) time. That is exactly what microbusinesses need. On the one side, no time is needed to check the value of collaterals because there are no collaterals. This obviously involves a higher credit risk that is balanced by more continuous control of financial parameters. On the other side, because of a lack of financial buffer, when a microbusiness needs money, it usually means: now. Long time for filling out tons of papers, to get them signed and counter-signed, and having the response arrived at the point of cash, might jeopardize the whole operation. The critical need is prompt cash by an institution close to its customer and ready to discuss any problems, in case they arise. This feature represents the real added value of CoopACs face to traditional banks. If cooperatives didn’t exist, they should have been invented. Not surprisingly, when the major banks realized their unavoidable lack of speed and customer proximity, they rushed to acquire well-established MFIs to fill the gap (Chen, Chang and Bruton 2017).
3.1.11. Simple and friendly procedures
Microbusinesses are usually run by sole owners and they rarely have legal support or can afford to hire one. So, when the times comes to read, comprehend and fill in long bank documents, they often get lost. The time spent reading such documents is time lost to the business and the knowledge to fully understand the meaning of sometimes obscure legal jargon is seldom available. On the contrary, cooperatives do not impose long and complex legal procedures, the lending process is simple and linear; the wording is straightforward and does not require costly legal advice to be correctly interpreted. Moreover, lack of collaterals and a relationship based on trust makes the whole procedure suitable even for down-to-earth understanding. Speaking a common language with the institution and receiving clear explanations about the procedures is priceless for the customer. It eases the relationship-building effort.
3.1.12. Long term relationship
The customer-institution relationship is central to the cooperative approach. On the lender side, every effort is made to make the borrower’s life easier, on the borrower side the only requirement is being trustworthy which means paying the interests when agreed and repaying the principal at expiration of the loan. However, a relationship is something deeper and, if possible, it should be entered in the financial statements as ‘goodwill’. Cooperatives are mostly interested in the relationship with their customers: that is what differentiates them from other, geographically, culturally and psychologically more remote, financial institutions. On the other side, as relationship builds up, credit amount may increase as well, allowing the business to grow together with customer creditworthiness. It seems simple to create such a win-win scenario but without all the features described in the previous sub-sections it may prove near-to-impossible.
3.2. Threats
Clearly, the overall situation is rarely so one-sided. CoopACs face risks and threats in a difficult game such as the one of the uncollateralized loan industry. In-situ analysis and the frequent presence of cooperative staff at customer premises to keep business development under control is a costly activity and although it can be made as efficient as possible, it will always be more expensive than remote control over financial statements, as is the case of traditional banks with their borrowers. Having identified a definitive source of inefficiency, the response is also straightforward: scaling the business up will produce scale economies. MFI is a sector of the Peruvian economy in which waves of mergers and consolidation occurred. This way the organizations of the industry hope to gain efficiency to compete better with more traditional financial players. One of the assets of cooperatives, namely customer proximity in a country where farmers are geographically dispersed, translate into a costly approach. Mobile communications technologies have certainly helped in meeting this issue although in some sense this is at the same time a strength and a threat for the financial institutions: getting in touch with dispersed customers is something main banks cannot afford to do but the cost of doing so is entirely on the cooperative’s shoulders. Saving and Credit Cooperatives are subject to supervision by the Peruvian financial authority, Superintendencia de Banca, Seguros y Administradoras Privadas de Fondos de Pensiones, (SBS),. This is a guarantee for investors that enjoy protection by an independent regulatory authority but it obviously carries more complexity in administrative procedures because of more complex legal and regulatory framework. The extra cost charged to the cooperatives, cannot but be reflected on its customers and investors. Traditional banks did not dismiss the matter as a minor issue, well aware that the large majority of the Peruvian economy is made up of small and microenterprises continuously in search for funding. They have entered the market by acquiring organizations already active in the industry (a few years before acquiring Mibanco via its MFI Edyficar, BCP failed direct entrance into the microfinance market; Flores, 2015). They now seem to have learnt how to break in. As basic microeconomics states, a profitable sector will attract more suppliers of the same goods or services to exploit the benefits available. Yet, this operation is seldom proceeding smoothly. As often happens, several genuine participants will be flanked by less genuine ones. New entrants with little or no expertise may compete by making access to credit easier, causing over indebtedness of enthusiastic borrowers, ruining the financial standing of their customers and causing systemic problems to the whole industry.
3.3. Evaluating CoopACs
The scenario presented above depicts a high-risk banking business, balanced by high expected returns for investors. Face to Government Bonds yielding very low interests, the sovereign defaults that occurred over the last decades (Argentina, Iceland, Greece), huge corporate scandals, both in the US (Enron, to name just one of many; Moody’s, 2000) and in Europe (Parmalat, among others; Di Staso, 2004), the much-more-than one-million-dollar question is: are the Cooperativas de Ahorro y Credito representing the long sought El Dorado or are the rather high interest rates they promise just the minimum premium necessary to balance out a high credit risk? In order to answer this crucial question, let us first describe the microcredit regulatory environment in Peru and then discuss the methodology that will be adopted for investigating the matter. If a portfolio of quality clients is required, it is necessary to perform a demanding credit evaluation regardless of the amount to be granted (Toledo, 2009).
4. Saving and credit cooperatives in Peru
4.1. The Peruvian Microcredit Environment
Peru has established itself as an ideal place to invest in microfinance. Late Peruvian governments regulated financial institutions in the country giving rise to six distinct legal structures:
1. Credit unions,
2. Cajas Municipales de Ahorro y Crédito (Municipal Savings and Loan Institutions [CMACs]),
3. Cajas Rurales de Ahorro y Crédito (Rural Savings and Loan Institutions [CRACs]),
4. Empresa de Desarrollo de la Pequeña y Micro Empresa (Entities for the Development of Small and Micronterprises [EDPYMEs]),
5. Banks,
6. other financial institutions.
The sector is rather dynamic and mergers and acquisitions have occurred in the industry boosting competition and search for efficiency (Chen, 2017).
Vanroose (2013) states that Peruvian microfinance institutions (including cooperatives) experienced considerable growth in the last ten years. An analysis carried out by Ebentreich (2005) shows good prospects for investment in the CoopAC sector in Peru as the country displays quite a healthy economic situation. Moreover, in recent years Peruvian governments have been struggling to reduce country risk by addressing several parameters at the same time. Gross National Income (GNI) per capita has been increasing: 1,970 USD in year 2000, 3,970 USD in 2009 and 6,470 USD in 2018 (source: World Bank) whereas poverty headcount ratio at national poverty lines as a percentage of the population is constantly decreasing, from 58.7% in 2004, down to 37.3% in 2008, 25.8% in 2012 and 20.5% in 2018 (source: World Bank, Global Poverty Working Group). Government debt at the end of 2018 was about 25.8% of GDP (source: https://tradingeconomics.com/peru/government-debt-to-gdp) and the exchange rate between Nuevo Sol to US Dollar has been relatively stable over the period 2009-2019, and definitely stable over the years 2014-2019. Table 1 shows the exchange rates at the end of each year between 2009 and mid-2019.
Table. 1. Exchange rate Nuevo Sol (PEN) to US Dollar (USD) 2009-2019.
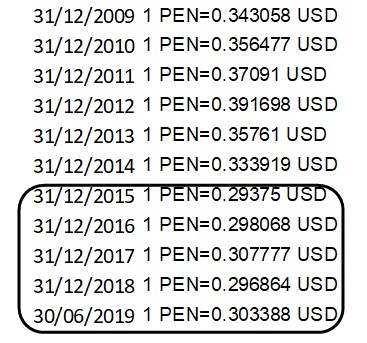
Source: Yahoo! Finance
The country is also showing a wise attitude toward higher education, something that is likely to show beneficial effects over the next five to ten years and onward. SUNEDU, the supervisory entity of university education has launched a thorough quality control program, with several universities having seen their license to provide higher education dropped. A 2014 law imposed all university teachers to hold at least a Master degree and the latest SUNEDU statistics about the gender of students at Peruvian universities display a slight majority of girls with respect to boys (362,791, or 50.3% to 358,884, or 49.7%. Source: SUNEDU). As many Latin American countries (and not only), Peru has traditionally been affected by a high level of political corruption but recent events are showing steps into the right direction. All these indicators lead to optimistic expectations over the reduction of country risk and an increase in the economic development of the country in the next decade or so. It therefore sounds hardly surprising that a stable economic environment, improving educational system, ease of access to credit sources, all together boosted entrepreneurship and a wise aptitude to accept reasonable risk. At the same time, efforts have been made to ensure stricter control over the financial sector as a whole, and the microcredit in particular. SBS, a constitutionally autonomous entity, accomplishes the main task of supervising the entire Peruvian financial system and it can authorize institutions to collect money from the general public (Intrisano and Micheli, 2015). The cooperative sector had not been immune from suspects of money laundering (Gómez Méndez and Janampa Acuña, 2019) yet, since SBS started supervising the microfinance sector, the image and reliability of microcredits has dramatically improved. ASBANC (2015) performed a comparison on the basis of 12 indicators in 55 countries-for the eighth year in a row and found that Peru leads the list, also showing an improvement in the total score compared to the result obtained in 2014. According to this study, Peru scored maximum points (100%) in 7 of the 12 indicators: (i) regulatory and supervisory capacity for financial inclusion, (ii) control and monitoring of portfolios, (iii) credit control and supervision of branches and agents, (iv) requirements for credit institutions, (v) unregulated credit information systems, (vi) market conduct rules and complaint mechanisms, and (vii) operating mechanisms for dispute resolution. The MFIs with the closest relation to sole person and microenterprises are the Cooperativas de Ahorro y Crédito. These institutions have a very peculiar approach to microcredit that is worth entering the details.
Peruvian CoopAC’s evaluation system is quite rigorous. It monitors client payments and is quick to categorize delinquent payers – or to recognize losses in financial statements accordingly. The following table summarizes such categorization.
Table. 2. Categorization of payers according to delay
|
Category |
Retail debtors |
Other debtors |
|
Normal |
Delay up to 8 days |
Good liquidity and cash flows |
|
Potentially problematic |
9 to 30 days delay |
Up to 60 days delay |
|
Delinquent |
31 to 60 days delay |
61 to 120 days delay |
|
Doubtful |
61 to 120 days delay |
121 to 365 days delay |
|
Loss |
120+ days delay |
365+ days delay |
Source: Meza Vásquez (2002)
According to Meza Vásquez (2002) CoopACs have developed different methodologies to grant loans to people, considering the particular characteristics they show.
A) Solidarity Group. It is a group loan, based on the joint guarantee, that is, the group is responsible for the debt of any of its members in case one cannot fulfil its obligations. The subject of credit becomes the solidarity group, which in turn obtains a sequential credit, since the amount to be received in each credit is gradually increased according to the payment behaviour it displayed. In order for the credit application to be approved, first credit analysts must visit each of the members of the group. Subsequently, a coordinator and a secretary are appointed to distribute the credit and comply with the follow-up work to ensure interest and principal repayment.
B) Individual credit. In this case the credit guarantee is individual. The entrepreneur obtains this type of credit mainly due to the need to require larger amounts, longer terms or the inability to be part of the solidarity groups and communal banks.
C) Associative Credit. In this case, the institution acts as an intermediary between the financial entity and an existing organization, which could be a cooperative or an association.
D) Community banks. They are a group of organized people who are called communal banks. They receive the first credit from an MFI, usually called the executing institution. For the management of the money, the communal banks appoint a credit committee that will be in charge of the administration of the external account, debt contracted with the microfinance enterprises, and the internal account, debt that the partners have contracted with the communal bank facilitated by their savings accumulation. The terms of loans of these groups are generally four months and have a joint guarantee. The conditions are agreed with the advisors of the financial entities before the formation of the communal banks (Delfiner, Pailhé and Perón, 2007).
Among cooperatives in Peru some consensus has grown about the adoption of PEARLS (the acronym standing for Protection, Effective Financial Structure, Asset Quality, Rates of Return and Costs, Liquidity and Signs of Growth), a structured tool based on 46 quantitative financial indicators, developed by the World Council of Credit Unions, However, quantitative indicators have as a prerequisite the existence of reliable financial statements but this is not always the case in the micro-entrepreneurial world, and in the socio-geographical environment subject to this study, it can be said that their existence is the exception rather than the rule.
4.2. Principles of the credit evaluation method
According to Pérez (2017), the principles under which the credit evaluation is carried out are the following:
A) Ease of access Due to the difficulties that traditional finance presents for granting credit to people with informal companies, a minimum number of requirements are required
B) Quick attention. It is very important because the employer needs to take advantage of business opportunities and meet personal and/or family needs
C) Minimum requirement of guarantees. Since its influence is not decisive in reducing credit risk, although they contribute to a better willingness to pay, the emphasis should be directed to the other qualitative and quantitative aspects.
D) Simplified procedures. Reduction of formal processes and reduction of documentation are necessary, in order to allow the client to waste as little time as possible.
E) Improving credit relationship. Cooperatives seek long-term relationships with their partner/clients, for this purpose the credits will be progressively increased, to improve the willingness to pay and consolidate the economic unit.
4.3. Supervision of Saving and Credit Cooperatives
Since 1999 all Savings and Credit Cooperatives in Peru are subject to supervision by the SBS. It produced a set of rules in resolution SBS Nº 540-99 and its subsequent modifications. The resolution establishes prudential rules related to requirements about capital, equity, cash availability, limits and prohibitions. In particular, it sets limits on leverage, investments, fixed assets, credit allowed, and reserves.
Savings and credit cooperatives not authorized to raise resources from the public in Peru, are regulated by the Single Ordered Text of the General Law of Cooperatives, Supreme Decree 074-90-TR and its regulations with SBS Resolution No. 480-2019 and Law 26702, General Law of the Financial System and of the Insurance and Organic System of the Superintendence of Banking and Insurance, as well as the amendment issued by Law 30822 of 07/02/2018, which modifies the corresponding norms, regarding the regulation and supervision of savings and credit cooperatives.
A) Leverage – art. 23, comma a
The amount of the contingent assets and credits of a cooperative, weighted by credit risk, in national or foreign currency, may not exceed 11 times its effective assets. In case of failure to accomplish this requirement, the CoopAC must deposit any increase in the level of its deposits in a special account in a multi-operation company of the financial system classified in topmost category. These deposits will be maintained until regularization. In order to avoid discrepancies, a Circular Letter (FENACREP Nº 005-2009 dated February 18, 2009), recommended a prudential level of Leverage of 7 times.
B) Investments – art. 23, comma c
- The holding of shares, bonds and certificates of participation in Mutual Funds and Investment Funds may not exceed 15% of the effective equity.
- In case of participations in other cooperatives or of shares or participations in companies that are intended to provide services to members or are compatible with their corporate purpose, they must not exceed 50% of their effective equity.
C) Fixed assets – art. 23, comma d
The acquisition of movable or immovable property necessary for the development of its activities may not exceed a total of 40% of its effective assets.
D) Credit allowed – art. 23, comma b
The total amount of credits granted to a member directly and indirectly, may not exceed five percent (5%) of the effective assets of the cooperative.
E) Reserves – art. 22, third paragraph
Cooperatives must reach a cooperative reserve not less than the equivalent of 35% of their share capital. This reserve is constituted annually allocating not less than 20% of the remaining, without prejudice that the statutes of the cooperatives determine higher percentages.
5. Methodology
In Peru there are 143 Savings and Credit Cooperatives registered with the SBS (as at February 2020). They publish financial statements and from those it is possible to compute several risk indexes. In order to provide an evaluation as thorough as possible of the CoopACs, beyond the mere analysis of financial statement, several multiple indexes have been computed together with those needed to work out some credit-risk models, namely Beaver’s model, Bathory model, Z-scores model, Springate analysis, logit analysis and H-factor model (Day, 2009). Credit risk assessment of Peruvian cooperatives is paramount for evaluating the sustainability of the entire sector and other academic researchers, as Quiroz Calderón (2020), attempted to investigate the topic, although using different methodologies. It must be noticed that, as the ratios described in the previous section are legal requirements; no entity subject to SBS supervision can fail to comply with them.
5.1. Hypothesis
The purpose of this paper is evaluating whether the Peruvian cooperative sector pays interest rates to its partners/depositors higher than market rate after taking into account credit risk. As highlighted in section 2.4 (Brealey et al., 2019; Brealey et al., 2020; Ross et al., 2022), according to financial theory, credit risk should be proportional to returns, so that high risk attracts higher returns whereas low risk cannot but ensure lower returns. Since Peruvian CoopACs pay interest rates very much higher than other financial market institutions (with rates of 7%, 9% and even 10% or above) it makes sense to assume that cooperatives run considerably high credit risk (García-Gutiérrez Fernández, 2000). Should that not be the case, it would mean that a market anomaly somehow materialised. This is the hypothesis of the paper and it is what the following section is about to investigate through financial analyses, ratio evaluation (Baorakis et al., 2007; Yamanaka et al. 2012; Bandyopadhyay, 2016) and several default indicators (Day, 2009). Causal analysis thereof is left for future research. All financial data about Peruvian cooperatives up to December 2018 have been downloaded from the FENACREP (Federación Nacional de Cooperativas de Ahorro y Crédito) website.
5.2. Financial statements analysis
Since the purpose of this study is assessing the credit risk of the whole cooperative system in Peru, no analysis of individual financial statement has been carried out: all figures represent the average of the whole industry.
5.3. Cash-flow and free cash-flow
– EBITDA as the net operating profit plus the non-cash items such as depreciation and amortization;
– net operating cash flow (NOCF) as the EBITDA less changes in working capital such as debtors, creditors, stock, prepayments and accruals – this is the primary cash from trading operations;
– operating free cash flow as the net operating cash flow less expenditure on fixed assets, investments and taxation.
5.4. Financial ratios
Both literature and practice consider a large number of financial reasons; to analyse the financial situation of a company, the quality of its management, the decision-making process and well-founded economic-financial projections. The comparison of such ratios from different periods also serves to detect trends. Their analysis helps to anticipate problems, tackle them and direct them along the best path to achieve the established goals. The analysis followed in this investigation calculated a few items and financial ratios. Some of them can be useful for direct analysis, while others are used in additional calculation to produce results and build models.
5.5. Growth sustainability
Sustainable growth is a critical concept in debt-based finance. Financial institutions look at growth before agreeing a loan, and so it is adequate for assessing cooperative’s creditworthiness. Without sustainable growth, no enterprise can hope to achieve success – and repay its debt. Among them, the most important are Retained Earnings over Sales as an indication of internal growth potentialities, Sales Growth over time, Current Assets over Sales as an efficiency indicator, and Profit Margins as an indication of efficient production process.
5.6. Beaver’s model
This risk model uses the following ratios (Beaver, 1966, Bellovary et al., 2007; Rahimipoor, 2013):
– operating free cash flow / total debt
– net profit after tax / total debt
– total debt / total assets
and evaluates them over time to assess risk adequacy.
5.7. Bathory model
This model also computes a handful of ratios and assesses their combination over time (Bathory, 1987; Day, 2009):
– Gross cash flow / Current debt;
– Pre-tax profit / Capital employed;
– Equity / Current liabilities;
– Tangible net worth / Total liabilities;
– Working capital/Total assets
The five ratios are summed up and then the result is divided by 5, implicitly assigning a 20% weight to each ratio. Critics of the Bathory model highlight the equal weight being given to all five factors to compute the riskiness of a business as being unscientific. Indeed, any method has its pros and cons and it is widely accepted that no method shows clear superiority to the others. Therefore, throughout this study it has been judged appropriate using a wide selection of risk assessment models and methods in order to reach a balanced outcome.
5.8. Z-Score
The Z-score method calculates five ratios (Altman, 1968; Altman et al. 1977; Altman et al., 2014; Bellovary et al., 2007):
– X1: Working capital / Total assets.
– X2: Retained earnings / Total assets
– X3: Earnings before income taxes / Total assets.
– X4: Market value of equity / Book value of debt
– X5: Sales / Total assets
For assessment of non-publicly listed companies, as is the case of CoopACs, a specific adaptation of the method can be used; in such a case the fourth ratio does not apply, the balance being given by different weights for the coefficients. The Z-score formula is:
Z-score = 6.56 * X1 + 3.26 * X2 + 6.72 * X3 + 1.05 * X5 (1)
Financially sound companies show Z scores above 2.6, while those scoring below 1.11 are in fiscal danger, possibly even heading toward bankruptcy, with the uncertain zone in the middle.
5.9. Springate analysis
It computes a set of four ratios (Bellovary et al., 2007, Day, 2009):
– X1: Working capital/total assets
– X2: Net profit before interest and taxes/total assets
– X3: Net profit before taxes/current liabilities
– X4: Sales/total assets.
Then the result S is computed, as a combination of the value of the ratios, multiplied by appropriate coefficients found empirically:
S = 1.03 * X1 + 3.07 * X2 + 0.66 * X3 + 0.4 * X4 (2)
If S < 0.862 then the firm is classified as ‘failed’.
5.10. Logit analysis
Again, the Logit analysis computes several ratios and applies coefficients to them (Aziz y Dar, 2004; Bellovary et al., 2007, Day, 2009).
– X1: Average inventories / sales
– X2: Average receivables / average inventories
– X3: (Cash + marketable securities) / total assets
– X4: Quick assets / current liabilities
– X5: Income from continuing operations / (total assets – current liabilities)
– X6: Long-term debt / (total assets - current liabilities)
– X7: Sales / (net working capital + fixed assets)
The result, y, is given by a constant plus the sum of the ratios multiplied by appropriate coefficients:
y = 0.239–0.108*X1–1.583*X2–10.78*X3+3.074*X4+0.486*X5–4.35*X6+0.11*X7 (3)
The peculiarity of this method is that the following formula:
P = 1 / (1 + ey) (4)
yields the probability of bankruptcy.
5.11. H-Factor model
The H-factor model takes again the form a sum of ratios multiplied by coefficients (Fulmer et al., 1984; Rahimipoor, 2013). The ratios are:
– X1: Retained earnings / total assets
– X2: Sales / total assets
– X3: EBIT / equity
– X4: Cash flow / total debt
– X5: Total debt / total assets
– X6: Current liabilities / total assets
– X7: Natural logarithm of tangible total assets
– X8: Working capital / total debt
– X9: Log EBIT / Interest
The H value gets computed by:
H = 5.528*X1 + 0.212*X2 + 0.073*X3 + 1.27*X4 -0.12*X5 + 2.335*X6 +0.575*X7 + +1.083*X8 + 0.984*X9 - 6.075 (5)
If the computation of the score yields less than zero, the company is classed as ‘failed’,
This study employs all the above variables, according to their respective models in order to evaluate CoopACs credit risk and probability of default. Further details about the above mentioned variables and models can be found in the references provided.
6. COOPAC Accounting evaluation
The financial statements of the 143 Peruvian CoopACs registered with SBS have been evaluated and the appropriate ratio worked out. The results are presented as average over all the CoopACs as the purpose of this study is to evaluate the global riskiness of the microcredit industry in Peru and not to suggest investment into one or another individual entity.
6.1. Cash-flow and free cash-flow
Table 3 reports the Net Operating Cash flow / Sales. The progression over the observation period clearly shows an increment of this ratio from -2.6% to +15.6%.
Table. 3. Cash flow 2007-2018 (data as %).
|
Cashflow Ratios |
2007 |
2008 |
2009 |
2010 |
2011 |
2012 |
2013 |
2014 |
2015 |
2016 |
2017 |
2018 |
|
Net Operating Cash Flow/Sales (%) |
-2.60 |
-13.74 |
7.40 |
-3.48 |
19.53 |
21.20 |
28.53 |
26.94 |
18.35 |
10.71 |
8.12 |
15.59 |
Source: authors’ elaboration based on FENACREP data.
The linear regression in Figure 1 displays a slope near 2.0 although the fit (R2) is rather low (<0.3). Nevertheless, the trend 2007-2018 is positive.
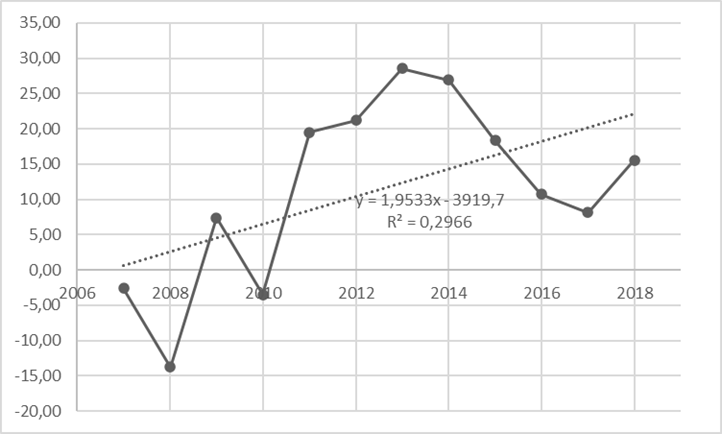
Figure. 1. Linear regression of Net Operating Cash Flow / Sales 2007-2018. Source: authors’ elaboration based on FENACREP data.
The Operating Free Cash Flow (FCF) shows a different story (Table 4): the trend is also positive but it displays a much more stable upward trend with no dramatic falls (as in case of the NOCF/Sales ratio) and the linear regression confirms the fit of the trend with a R2 value of nearly 0.75 (Figure 2). As the FCF is a measure of the overall value of the company and, when not distributed as dividend, it may also be used to honour future firm’s obligations, the upward trend conveys a reassuring message about the reliability of the industry.
Table. 4. Average free cash flow 2007-2018 (data in PEN).
|
FREE CASH FLOW |
2007 |
2008 |
2009 |
2010 |
2011 |
2012 |
2013 |
2014 |
2015 |
2016 |
2017 |
2018 |
|
Net Operating Profit (NOP) |
214,460 |
147,018 |
223,535 |
274,920 |
632,747 |
653,544 |
574,681 |
542,529 |
782,968 |
855,509 |
977,869 |
857,074 |
|
Depreciation, Amortization, Non-cash Items |
381,061 |
641,980 |
689,098 |
706,330 |
1,029,666 |
1,440,737 |
1,372,679 |
1,825,736 |
1,298,372 |
1,682,544 |
1,729,528 |
1,864,538 |
|
EBITDA |
595,521 |
788,998 |
912,634 |
981,250 |
1,662,413 |
2,094,281 |
1,947,360 |
2,368,265 |
2,081,340 |
2,538,053 |
2,707,397 |
2,721,612 |
|
Changes in Net Working Assets |
-268,726 |
489,283 |
243,116 |
-77,351 |
1,389,512 |
-451,960 |
341,126 |
200,982 |
396,647 |
1,053,728 |
-345,421 |
965,535 |
|
Net Operating Cash Flow (NOCF) |
326,795 |
1,278,281 |
1,155,749 |
903,899 |
3,051,925 |
1,642,321 |
2,288,486 |
2,569,246 |
2,477,987 |
3,591,781 |
2,361,976 |
3,687,147 |
|
Expenditure on Fixed Assets |
467,213 |
659,427 |
405,038 |
649,162 |
861,057 |
574,811 |
691,570 |
1,209,421 |
454,534 |
1,027,385 |
1,260,735 |
1,553,447 |
|
Net Cash Outflow for Taxation |
8,808 |
11,203 |
11,730 |
6,920 |
7,297 |
24,145 |
17,550 |
19,020 |
24,653 |
17,627 |
26,647 |
20,308 |
|
Operating Free Cashflow |
802,816 |
1,948,910 |
1,572,517 |
1,559,981 |
3,920,279 |
2,241,277 |
2,997,607 |
3,797,687 |
2,957,174 |
4,636,793 |
3,649,358 |
5,260,901 |
Source: authors’ elaboration based on FENACREP data.
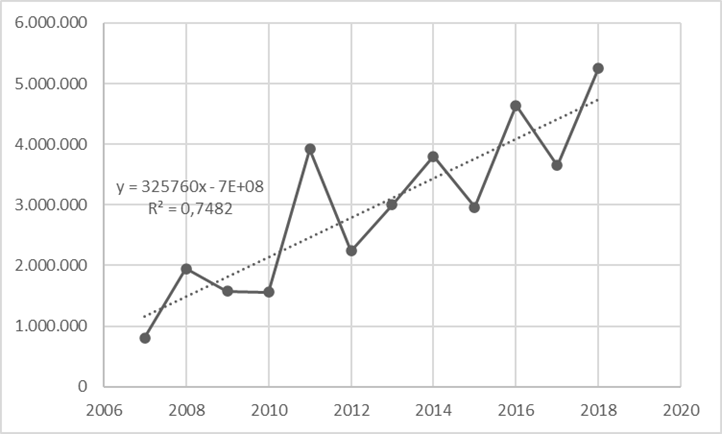
Figure. 2. Operating Free Cash Flow. Source: authors’ elaboration based on FENACREP data.
6.2. Financial ratios
The scenario is less clear-cut as far as other financial ratios are concerned. As shown in Table 5, Return on Sales has been decreasing over the observation period and particularly over the last three years. However, it must be taken into account that sales have passed from 2,613,682 thousand PEN to 12,319,862 thousand PEN; it seems likely that 371% sales increase penalised at some extent profitability. As far as Return on Equity is concerned, with the exception of 2009 value the values are relatively stable; figure 3 shows an upward regression line with a slope 1.85 although with a low R2, due to the abnormal 2009 value. Gross profit / Sales does not raise any issue as it ranges between 83.30 and 76.40, with a slightly downward trend, where the same considerations discussed for the Return on Sales ratio apply. More worrisome are the two subsequent ratios, Profit before Tax / Sales and Return on Assets. They both suffer somehow from the general reduction in profitability experienced by the CoopAC sector over the last twelve years. An interesting comparison is provided by the Operating Efficiency ratios: face to a 12% increase of debtor days (due to longer repayment period allowed), the debtors days augment of over 32%. It means that investors agree to longer return period in order to increase the return rate. Yet, without a fairly strong confidence in the cooperative system this extension would not be possible. It is a sign of the confidence that general public puts in the system – and confidence in finance is always a good sign. The Quick Ratio, usually a critical test to assess companies’ solvability, is not very significant for CoopACs as it takes into account non-operating financing, and this explains the very large values for the ratio (ranging between 15 and 37, with an upward trend). The best news comes from the Working Capital, which augmented from 4billion PEN to nearly 17billion PEN over the observation period. This represents a 300% increase in twelve years, with an average 25% per annum. It means that the CoopAC business has literally boomed in recent years, confirming once more the dynamicity of Peruvian economy at microenterprise level and the confidence ordinary people have on it. Again, a good sign for the country’s economic future.
Table. 5. Financial ratios 2007-2018 (data as indicated on row heading).
|
Core Ratios |
2007 |
2008 |
2009 |
2010 |
2011 |
2012 |
2013 |
2014 |
2015 |
2016 |
2017 |
2018 |
|
Return on Sales (NPAT/Sales %) |
18.10 |
17.19 |
17.70 |
14.26 |
14.89 |
19.53 |
16.19 |
15.54 |
17.01 |
17.14 |
12.90 |
8.26 |
|
Return on Equity (NPAT/Equity %) |
6.54 |
0.43 |
-63.21 |
5.21 |
6.27 |
7.65 |
7.74 |
6.24 |
6.55 |
2.20 |
10.64 |
4.11 |
|
Profitability |
|
|
|
|
|
|
|
|
|
|
|
|
|
Gross Profit / Sales (%) |
83.30 |
80.91 |
81.04 |
81.69 |
76.25 |
79.51 |
78.42 |
77.33 |
78.37 |
77.57 |
77.31 |
76.44 |
|
Profit before Tax / Sales (%) |
18.26 |
17.45 |
17.85 |
14.38 |
14.97 |
19.67 |
16.27 |
15.63 |
17.12 |
17.22 |
13.02 |
8.36 |
|
Return on Assets ( %) |
2.01 |
1.64 |
1.30 |
0.69 |
1.34 |
2.02 |
1.54 |
1.36 |
1.59 |
0.96 |
1.09 |
0.31 |
|
Operating Efficiency |
|
|
|
|
|
|
|
|
|
|
|
|
|
Trade Receivables (Debtor) Days |
1,537 |
1,682 |
1,601 |
1,758 |
1,809 |
1,670 |
1,764 |
1,766 |
1,725 |
1,684 |
1,741 |
1,723 |
|
Creditors Days |
4,460 |
83,634 |
4,046 |
16,991 |
4,724 |
20,786 |
7,911 |
5,660 |
4,778 |
7,677 |
6,421 |
5,897 |
|
Financial Structure |
|
|
|
|
|
|
|
|
|
|
|
|
|
Quick Ratio (times) |
32 |
32 |
43 |
34 |
15 |
28 |
24 |
16 |
20 |
35 |
30 |
37 |
|
Working Capital (thousands PEN) |
4,172 |
5,218 |
5,354 |
5,604 |
9,779 |
8,402 |
8,779 |
9,602 |
10,922 |
14,778 |
18,293 |
16,765 |
Source: authors’ elaboration based on FENACREP data.
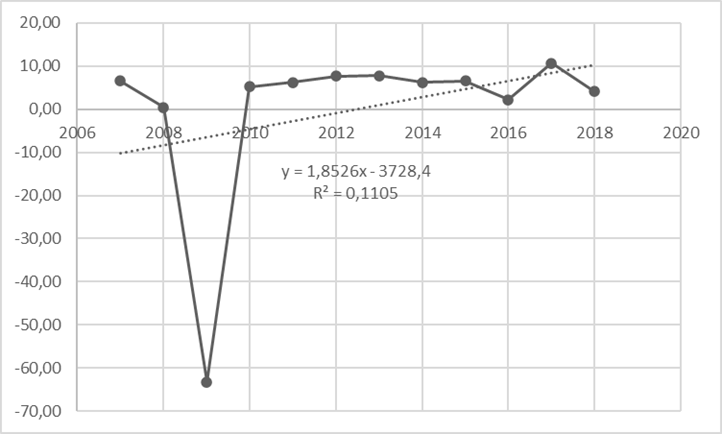
Figure. 3. Return on Equity (NPAT/Equity). Source: authors’ elaboration based on FENACREP data
6.3. Growth sustainability
Despite decreasing numbers, growth sustainability also conveys good news for the country. If 20% or so per annum is hardly a sustainable growth rate, rates around 8-9% (or more) over recent years show an industry that can still ensure significant growth while on the stabilizing trend. Very high growth rates are certainly good news but they usually correspond to new and raising businesses – and the riskiness goes hand in hand with growth in juvenile years. A stable yet strong growth is at the same time good and safe news, as it can reasonably be expected to continue over the foreseeable future: that is what savvy investors look for!
Table. 6. Growth ratios 2007-2018 (data as percentage).
|
Growth Formulas |
2007 |
2008 |
2009 |
2010 |
2011 |
2012 |
2013 |
2014 |
2015 |
2016 |
2017 |
2018 |
|
Retained Earnings / Sales (%) |
18.10 |
17.19 |
17.70 |
14.26 |
14.89 |
19.53 |
16.19 |
15.54 |
17.01 |
17.14 |
12.90 |
8.26 |
|
Sales Growth % |
19.83 |
23.19 |
14.98 |
10.48 |
19.87 |
9.94 |
9.99 |
19.46 |
12.76 |
9.93 |
11.42 |
8.10 |
|
Current Assets / Sales (%) |
552.71 |
607.48 |
574.82 |
680.37 |
644.82 |
623.75 |
640.09 |
633.28 |
648.42 |
665.43 |
651.37 |
651.86 |
|
Profit Margin (%) |
18.10 |
17.19 |
17.70 |
14.26 |
14.89 |
19.53 |
16.19 |
15.54 |
17.01 |
17.14 |
12.90 |
8.26 |
Source: authors’ elaboration based on FENACREP data.
6.4. Credit risk models
The results of credit risk models described in the previous section are reported in table 6.
Table. 7. Credit risk models 2007-2018 (data in units except BEAVER in times and LOGIT in percentage).
|
|
2007 |
2008 |
2009 |
2010 |
2011 |
2012 |
2013 |
2014 |
2015 |
2016 |
2017 |
2018 |
|
BEAVER |
|
|
|
|
|
|
|
|
|
|
|
|
|
OpFCF/TotDebt |
999.46 |
919.97 |
9.95 |
1228.76 |
113.53 |
-60.55 |
35.57 |
58.11 |
554.54 |
-4.20 |
-30.51 |
50.39 |
|
NPAT/TotDebt |
35.17 |
21.18 |
11.36 |
28.35 |
23.24 |
88.96 |
43.91 |
28.00 |
22.52 |
8.77 |
60.87 |
25.64 |
|
TotDebt/TotAsset |
0.05 |
0.06 |
0.07 |
0.07 |
0.08 |
0.06 |
0.05 |
0.05 |
0.05 |
0.07 |
0.06 |
0.07 |
|
(Progress over time) |
|
|
|
|
|
|
|
|
|
|
|
|
|
|
|
|
|
|
|
|
|
|
|
|
|
|
|
BATHORY |
59.14 |
67.62 |
11.93 |
79.12 |
11.70 |
25.69 |
16.29 |
11.24 |
43.54 |
11.17 |
22.34 |
17.47 |
|
(Progress over time) |
|
|
|
|
|
|
|
|
|
|
|
|
|
|
|
|
|
|
|
|
|
|
|
|
|
|
|
Z-SCORE |
3.99 |
3.88 |
3.86 |
3.43 |
3.32 |
3.78 |
3.39 |
3.19 |
3.51 |
3.53 |
3.32 |
3.11 |
|
(OK > 2.6, NOK < 1.11) |
|
|
|
|
|
|
|
|
|
|
|
|
|
|
|
|
|
|
|
|
|
|
|
|
|
|
|
SPRINGATE |
1.55 |
1.71 |
2.14 |
1.52 |
1.02 |
1.45 |
1.34 |
1.04 |
1.01 |
1.58 |
1.59 |
1.08 |
|
(NOK if < 0.862) |
|
|
|
|
|
|
|
|
|
|
|
|
|
|
|
|
|
|
|
|
|
|
|
|
|
|
|
LOGIT |
0.00% |
0.00% |
0.00% |
0.00% |
0.00% |
0.00% |
0.00% |
0.00% |
0.00% |
0.00% |
0.00% |
0.00% |
|
(Probability of bankruptcy) |
|
|
|
|
|
|
|
|
|
|
|
|
|
|
|
|
|
|
|
|
|
|
|
|
|
|
|
H-FACTOR |
3,194.11 |
1,757.99 |
736.02 |
1,236.52 |
605.07 |
1,101.55 |
585.26 |
531.66 |
706.26 |
981.55 |
15.77 |
678.42 |
|
(Failed if < 0) |
|
|
|
|
|
|
|
|
|
|
|
|
Source: authors’ elaboration based on FENACREP data
The Beaver’s factors show ups and downs, with ups overcoming the downs and only three years, out of thirteen, displaying a negative value for Operating Free Cash Flow / Total Debt. It is to be noticed that, as far as Total Debt / Total Assets, a lower value represents a better result, as debt is decreasing. It is to be noticed that Beaver’s model yields the least reliable results as the item appearing in all three ratios, Total Debt, only includes the indebtedness of the CoopAC on top of deposits. If on the one side this is acceptable as deposits are, from the pure accounting point of view, ‘cost of goods sold’, nevertheless that is exactly what matters most to investors. So, for example, the Total Debt / Total Assets ratio yields very low values over the whole observation period but it is not a safe way to assess the risk of CoopAC’s liabilities. Other models provide more reliable assessment approaches.
Similarly, Bathory model also shows ups and downs and the general trend is decreasing, with a linear regression slope of -3.706 and a R2 of just 0.2965. This confirms that Bathory’s model is also scarcely reliable for this set of data, mainly because the equal weights applied to the five factors, which Day (2009, p.185) deems ‘unscientific’. Indeed, the author considers Bathory’s models less reliable with respect to the following four. All other models, although occasionally showing decreasing results among uprising ones, never provide hints of failure of the whole system; at the contrary, they all yield values very far away from bankruptcy or even a remote possibility of credit risk (indicated in table 7 by the criterion at the bottom line of each model). According to the credit risk models used the Peruvian CoopAC industry looks safe and low-risk compared to interest rates.
7. Discussion
This study worked out several ratios, indexes and methods. Overall, most of them display a resilient cooperative system. The few cases in which results suggest a high risk level, are interspersed among several other for which the system looks strong and solid. This may be due to the optimistic attitude Peruvians have toward the national economy and its future. Although average salaries are lesser than in more developed countries, the marginal propensity to consume of the average Peruvian citizen is relatively high. This comply with the basic requirement of a solid economy (with inflation under control, as is the case of Peru), according to the two well-known formulas:
Y = C + I + G + X (6)
where Y is the country’s production, C represents consumption, I is private investment, G is government spending and X is net export, the algebraic sum of total export minus total import. In order to impulse economy, elementary economic theory teaches that production must grow, therefore calling for increments in all the right-hand-side terms, in particular consumption. On its turn, consumption C can be written as:
C = C0 + c(Y – T) (7)
where C0 is independent spending (the minimum needed for basic survival, even in absence of income), c is the marginal propensity to consume, Y is net income (personal income, Y, minus tax, T). The marginal propensity to consume, which represents the slope of the line, proportionally increments consumption as net income grows. On the other side, since the GDP per capita in Peru is relatively low when compared to more developed countries, most consumption does address basic and elementary needs, leaving little room for the excesses of consumerism. People spend money for real needs, spending fires the economy up, promotes further investments, in a large majority of cases into individual, family-driven, micro and small businesses, often buried in the informal economy. Although the governments officially fight against the informal economy and its distortions, especially at the fiscal level, there is a certain degree of acceptance that bringing all the informal economy to light might disrupt a system experimented over the decades (and perhaps centuries) with the result to ruin the micro entrepreneurship that actually keeps the country alive and profitable. Wisely, Peruvian governments, although committed to the goal, are not hurrying this process up excessively. Overall the system is coping well with the difficulties of this industry. The Supervision Authority, SBS, is strict in establishing rules and CoopACs older than fifty years do not represent exceptions. The outcome of this analysis is that the Peruvian cooperative system does commit to paying high interest rates, compared to other financial institutions, with no exceedingly higher credit risk. In a world which in the last decade experienced decreasing, and sometimes record low, interest rates, this seems a noteworthy exception.
8. Conclusion
In this study
we evaluated CoopACs in Peru according to several parameters: analyses of the
financial statements, financial ratios suggested by the Peruvian supervising
authority and default risk indicators, as suggested by the literature. The
purpose was to compare the hypothesis of a financial anomaly in the Peruvian
debt market (low risk compared to high profitability) versus an adequate
profitability-risk ratio where the high deposit rates offered by the CoopACs
just balance out their default risk. The research did not intend to pinpoint
one or more weak financial institution, nor to recommend the solid ones. The
purpose was entirely academic and focusses on the country’s Saving and Credit
Cooperative sector; all result encompass averages over the entire population,
as available at the end of the year 2018. Both Net Operating Cash Flows and
Free Cash Flows display a rather reassuring picture and, given the importance
of cash flows for any financial institutions, this is certainly a safe message.
Less reassuring is the outcome of financial ratio analysis: ROE, ROA, Return on
Sales, Profit Margin, and EBIT/Sales are all decreasing over the previous
decade but still relatively safe. Ratios do not raise immediate worries
although long-term future trends should be carefully monitored. Similarly,
default risk indicators show erratic behaviours but are still far from any risk
of bankruptcy; in particular, Logit analysis, which yields probability of
bankruptcy, consistently displays 0% across all years under investigation.
Therefore, it is possible to conclude that the sector, although far from stable
(the opposite should be surprising, given the large number of cooperatives of
very different focus, sizes, geographical location and characteristics) does
not display systemic risks. Nevertheless, as usual before any investment,
accurate evaluation cannot be replaced by sector-wide analysis. And The
goal of this paper was to evaluate whether a financial anomaly, given by the
low risk of bankruptcy and the high deposit interest paid by the CoopACs,
exists in Peru. The results display a rather strong capability of the Peruvian
cooperative system to cope with risk. Overall, the industry in Peru looks in
very good shape and it can be stated that an anomaly exists: Peruvian CoopACs
do not display a credit risk comparable to the high interest rates they offer
to investors. Investigating the reasons for this apparent anomaly in the global
financial system is a path for further research. As far as this study is
concerned, based on the widely accepted methodologies adopted, we can safely
conclude that the credit risk compares favourably with the interest rates paid
by the Saving and Credit Cooperatives in Peru.
8.1. Limitations and future research
The financial information of all CoopACs in Peru, obtained for the preparation of this article, was obtained under a non-sanctioning supervisory legal framework entrusted to the same Cooperatives (Resolution_N°_0540-1999_Regulations_Cooperatives.pdf, nd). During development of the present investigation, the norms that regulate CoopACs have been modified and credited with the presence of a new supervisory entity. Nevertheless, financial statements for all cooperatives will not be available before the 2023-2024 timeframe. Therefore, further research is suggested in the next years. Future research should also be aimed at investigating the reasons for this anomaly in the financial system, trying to explain and causally analyze the high profitability offered by Peruvian cooperatives to their investors who face considerably low credit risk in this market.
Acknowledgment: The authors are indebted to Dr. Waldomero Loja Rodríguez, Mg. Mercedes Zaldivar Velásquez, Mg. Alejandrina Trinidad Alomia Sotomayor, and Mg. Luis Walter Mego Tucta for the useful information and support they provided during the production of this paper.
9. References
Altman E. I. (1968) Financial
Ratios, Discriminant Analysis and the Prediction of Corporate Bankruptcy.
Journal of Finance, N° 23(4), pp. 589-609. DOI:
10.1111/j.1540-6261.1968.tb00843.x.
Altman E. I., Haldeman R. G., Narayanan P. (1977) Zeta Analysis: A New Model to Identify Bankruptcy Risk of Corporations. Journal of Banking & Finance, N° 1(1), pp. 55-70. DOI: 10.1016/0378-4266(77)90017-6.
Altman E. I., Iwanicz-Drozdowska M., Laitinen E.K., Suvas A. (2014). Distressed Firm and Bankruptcy prediction in an international context: a review and empirical analysis of Altman’s Z-Score Model. Working paper. University of New York.
Angulo Villarreal N. (2019) El Estado y la promoción de modalidades económicas asociativas en el Perú. Revista Cultura Económica, N° 37(97), pp. 113.142.
APEC (2011) Asia-pacific Economic Cooperation. Workshop on Microfinance Best Practices, Hanoi, Viet Nam, 7-8 April 2011.
ASBANC (2015) For 8 consecutive years, Peru's leading microfinance. https://www.asbanc.com.pe. Accessed on 07/06/2019.
Asencios Trinidad C., López Guerrero F., Poma Cornejo H., Babilón Grados J. (2018) Buenas prácticas de gestión de riesgo de crédito y su impacto en la creación de valor: los casos de las seis cooperativas de ahorro y crédito top del Perú. Master thesis. Pontificia Universidad Católica del Perú.
Aziz M., Dar H. (2004) Predicting Corporate Bankruptcy: Whither do We Stand? Corporate Governance, 6, pp.18-33.
Baesens B., Rösch D., Scheule H. (2016) Credit Risk Analytics. Hoboken, NJ: John Wiley & Sons, Inc.
Bandyopadhyay A. (2016) Managing
Portfolio Credit Risk in Banks”. Daryaganj, Delhi: Cambridge
University Press.
Banner A., Fernholz D. (2008) Short-term relative arbitrage in volatility-stabilized markets. Annals of Finance, N° 4(4), pp.445–454. DOI: 10.1007/s10436-007-0085-z.
Baourakis, G., Conisescu M., van Dijk G., Pardalos P., Zopounidis, C. (2007) A multicriteria approach for rating the credit risk of financial institutions. Computational Management Science, 6(3), pp. 347–356. DOI: 10.1007/s10287-007-0050-3.
Bathory A. (1987) The Analysis of Credit. New York, NY: McGraw Hill.
Beaver W. (1966) Financial ratios as predictors of failure. Journal of Accounting Research, N° 4(4), pp. 71–111.
Bellovary J., Giacomino D., Akers M. (2007) A Review of Bankruptcy Prediction Studies: 1930-Present. Journal of Financial Education, N° 33 (Winter), pp. 1-42.
Berk J., DeMarzo P. (2020) Corporate Finance. 5th ed. Harlow, UK: Pearson.
Borda Mamani R. and Basso D. (2020) El surgimiento del cooperativismo en el Perú: la Convención-Cusco. Emancipação-Ponta Grossa, N° 19 (especial), pp. 24-32. DOI: 10.5212/Emancipacao.v.19.1914664.002
Bornstein D. (1997) The Price of a Dream. The Story of the Grameen Bank. Chicago, IL: The University Chicago Press.
Brealey R., Myers S., Allen F. (2019) Principles of Corporate Finance. 13th ed. New York, NY: McGraw Hill.
Brown A. (2004) The Origins and Evolution of Credit Risk Management. Global Association of Risk Professionals. September/October Issue 20.
Chen, J., Chang, A. Y., & Bruton, G. D. (2017) Microfinance: Where are we today and where should the research go in the future? International Small Business Journal, N° 35(7), pp. 793-802. DOI: 10.1177/0266242617717380.
Chen H. (2017) Peruvian Microfinance: Mergers and Acquisitions and Industry Outlook. Perspectives on Business and Economics, N° 35 – Leveraging Peru's Economic Potential. Lehigh University. https://preserve.lehigh.edu/perspectives-v35/7.
Conger L., Inga P., Webb R. (2009) El Árbol de la Mostaza - Historia de la Microfinanzas en el Perú. Lima, Peru: Universidad San Martín de Porres.
Day A. (2009) Mastering Risk Modelling. Harlow, UK: FT Prentice Hall.
Davidson L. (2013) The Truth about Microfinance in Peru. World Economic Forum Annual Meeting of the New Champions. 05/09/2013.
Delfiner, M., Pailhé, C., Perón S. (2007) Microfinanzas: un análisis de experiencias y alternativas de regulación. Revista de Temas Financieros, N° IV (1), pp. 69-70. Available at http://www.sbs.gob.pe/Portals/0/jer/EDIPUB_VOLUMEN4/63-118.pdf.
Di Staso M. (2004) Il caso Parmalat. Libera Università Internazionale degli Studi Sociali ‘Guido Carli’.
Ebentreich A. (2005) Microfinance Regulation in Peru: Current State, Lessons Learned and Prospects for the Future. Essays on Regulation and Supervision. IRIS Center. Department of Economics. University of Maryland.
Flores A. (2015) Evaluación de los estados financieros para otorgar créditos a pequeñas y microempresas en Financiera Edyficar y como trasciende el sistema financiero en los clientes. Graduation thesis. Universidad Nacional del Altiplano, Puno, Perú. Available at https://repositorio.unap.edu.pe/handle/20.500.14082/2224.
Fulmer J., Moon J., Gavin T., and Erwin J. (1984) A bankruptcy classification model for small firms. The Journal of Commercial Bank Lending, N° 66(11), pp. 25-37.
Galbraith J. (2009) The Great Crash 1929. New York, NY: Houghton Mifflin Harcourt.
García-Gutiérrez Fernández, C. (2000) Análisis de la solvencia y del riesgo económico-financiero de la sociedad cooperativa. El riesgo sobre la rentabilidad de los socios. REVESCO. Revista de Estudios Cooperativos, Tercer Cuatrimestre, N° 72, pp. 51-86.
Goolsbee A., Levitt S., Syvreson C. (2020) Microeconomics. 3rd ed. New York, NY: Worth Publishers.
Gómez Méndez J. and Janampa Acuña N. (2019) Pericia contable y lavado de activos en Cooperativas de Ahorro y Crédito del Perú. Quipukamayoc, N° 27(55), pp. 25-29. DOI:10.15381/quipu.v27i55.17175.
Hayes S. (1992) A quién debe usted conceder crédito: análisis no financiero. Crédito y cobranzas: guía práctica (2a ed). México, D.F.: Ecasa.
Intrisano C., Micheli A. (2015) Microfinance in Peru as Part of the Strategy of an International Investment Fund. International Journal of Economics and Finance, N° 7(8), pp.281-293. DOI: 10.5539/ijef.v7n8p281.
Jordan B., Ross S., Westerfield R., Jaffe J. (2022) Corporate Finance. 13th ed. New York, NY: McGrawHill.
Kindleberger C., Aliber R. (2005) Manias, Panics, and Crashes. A History of Financial Crises. Hoboken, NJ: John Wiley & Sons.
Krugman P., Wells R. (2020) Microeconomics. 6th ed. New York, NY: Worth Publishers.
Marshall B., Nguyen N., Visaltanachoti N. (2013) ETF arbitrage: Intraday evidence. Journal of Banking & Finance, N° 37(9), pp. 3486–3498. DOI: 10.1016/j.jbankfin.2013.05.014.
Meza Vásquez G. (2002) Medición del riesgo en la evaluación del crédito a la microempresa. COPEME-Edaprospo. Callao.
Moody’s (2000) Moody’s
Upgrades All Enron Corp Long Term Debt Ratings”. Moody’s Investors
Service, 23/01/2000.
Newman, A., Schwarz, S., Ahlstrom, D. (2017) Microfinance and entrepreneurship: An introduction. International Small Business Journal, N° 35(7), pp. 787-792. DOI: 10.1177/0266242617719314.
Pait S. (2009) The Microfinance Sector in Peru: Opportunities, Challenges And Empowerment With Gender Mainstreaming. WEMAN Programme. Working paper.
Perez C. (2017) La evaluación crediticia y su relación con el riesgo crediticio, en la Cooperativa de Ahorro y Crédito San Viator Ltda. Master thesis. Universidad Nacional Mayor de San Marcos, Lima, Perú. Available at https://cybertesis.unmsm.edu.pe/handle/20.500.12672/7262.
Quiroz Calderón B. (2020) Credit Scoring Una Herramienta Para Minimizar el Riesgo de Crédito de las Institutiones Microfinancieras-Peru. Quipukanayoc, N° 28(56), pp. 69-75. DOI: 10.15381/quipu.v28i56.17697.
Rahimipoor A. (2013) A comparative study of bankruptcy prediction models of Fulmer and Toffler in firms accepted in Tehran Stock Exchange. Journal of Novel Applied Sciences, N° 2(10), pp. 522-527.
Rayo Canton, S. Lara Rubio, J. Camino Blasco, D. (2010) Un Modelo de Credit Scoring para instituciones de microfinanzas en el marco de Basilea II. Journal of Economics, Finance and Administrative Science, N° 15(28), pp.89-124. ISSN 2077-1886.
Shahriar, A., Garg, M. (2017) Lender–entrepreneur relationships and credit risk: A global analysis of microfinance institutions. International Small Business Journal, N° 35(7), pp. 829-854. DOI: 10.1177/0266242617701189.
Sherman A., & Tana, K. (2008) The subprime crisis: Lessons for global business. Journal of Corporate Accounting & Finance, N° 19(6), pp. 55–59. DOI:10.1002/jcaf.20434.
Toledo E. (2009) Microfinanzas: diagnóstico del sector de la micro y pequeña empresa y su tecnología crediticia. Contabilidad y Negocios, N° 4(8), pp. 23-32. Available at https://www.redalyc.org/articulo.oa?id=281621776004.
Vanroose A., D’Espallier B. (2013) Do microfinance institutions accomplish their mission? Evidence from the relationship between traditional financial sector development and microfinance institutions’ outreach and performance. Applied Economics, N° 45(15), pp. 1965-1982. DOI: 10.1080/00036846.2011.641932.
Yamanaka S., Sugihara M., Nakagawa H. (2012) Modeling of Contagious Credit Events and Risk Analysis of Credit Portfolios. Asia-Pacific Financial Markets, N° 19(1), pp. 43–62. DOI: 10.1007/s10690-011-9141-9.
Yunus M. (2007) Banker to the Poor. New York, NY: Public Affairs.